
| Home | Introduction | Features | Screenshots | Download | Links | Help | About |
www.icons8.com
|
|
|
www.icons8.com |
You can select the debugger from the console with F6.
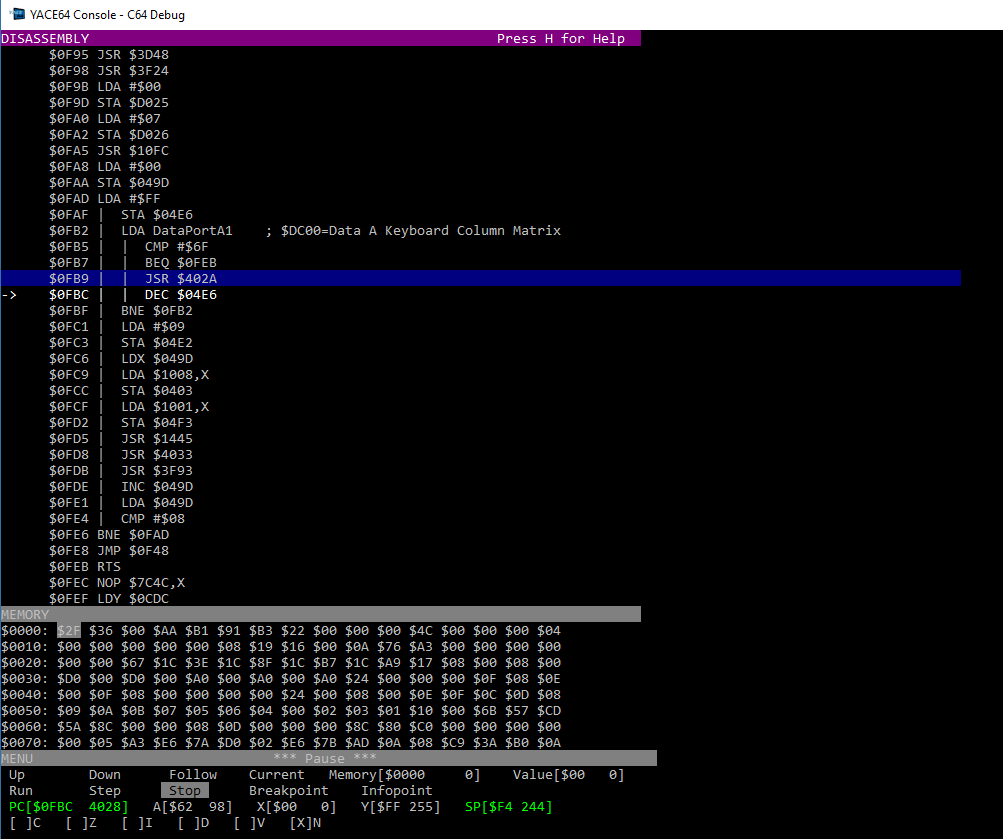
The Debugger has three section, change the section with the TAB key:
The disassembly shows the memory content as CPU instructions. You can navigate with the cursor keys as follows:
| Up | Move to previous instruction |
| Down | Move to next instruction |
| Right | Follow branch or jump destination |
| Left | Move to current (PC) instruction |
| Page Up | Scroll a page of instructions up |
| Page Down | Scroll a page of instructions down |
| Return | Step next instruction in pause mode |
| Space | Toggle Run/Pause |
| B | Toggle a breakpoint at the select instruction |
| I | Toggle an infopoint at the select instruction |
The memory sections shows the current content of the memory from the
current view of the CPU.
Use the cursor and page up/down keys to navigate to a specific address.
Values are marked green, when they are changed.
The menu lets you control the execution state, change memory, registers and much more.
The debugger will automatically disassemble, when the emulator is pause.
Within the debugger breakpoints can be set and cleared. The CPU
registers and flags are updated on every pause, single step or reaching
a breakpoint. Changed values are marked green.
With breakpoints you can trigger and automate actions like changing log levels, creating screenshots and much more.