
| Home | Introduction | Features | Screenshots | Download | Links | Help | About |
www.icons8.com
|
|
|
www.icons8.com |
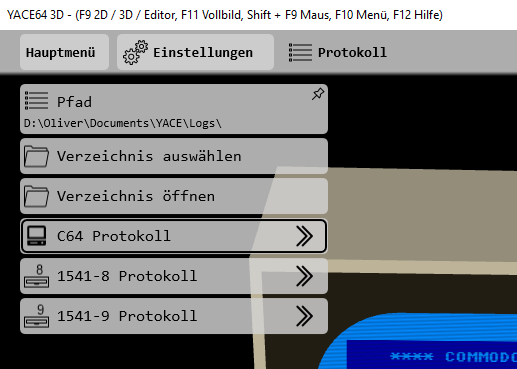
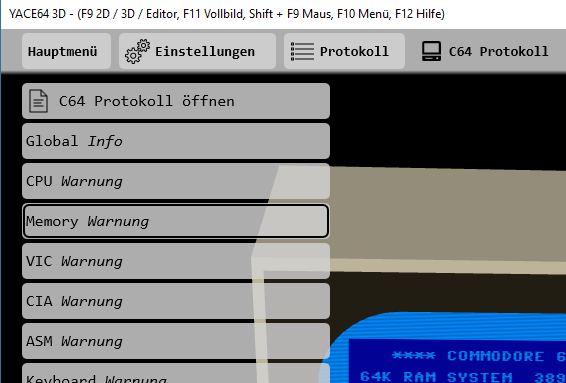
You can activate tracing for the C64 and the 1541 devices separatly. Each device has different trace groups like CPU, Memory, VIC and so on. For each group you can set the detail level from Off to Debug.
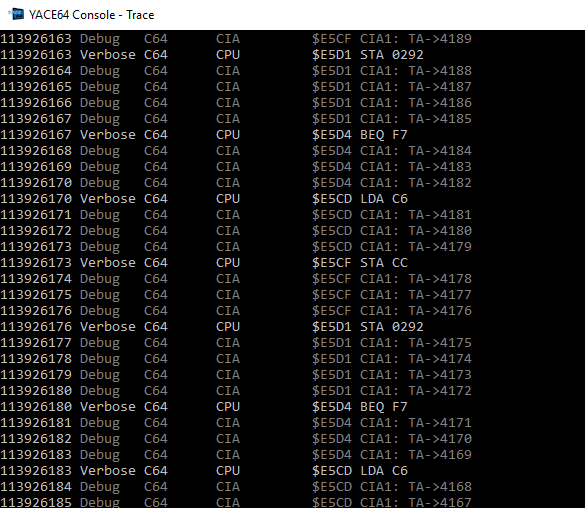
The trace can be viewed life within the console or
as a text file in the log folder (your Documents\YACE\logs folder). The log
folder can directly be opened from the menu.
Aktivate the console from the menu and select the tracing console with F5:
Activating many log types with a high level, can reduce the performance significant!
A log file output like this...
V CPU 231674229 $E5D1 136 091: STA 0292; [Z___B__] A:00
X:00 Y:0A S:F3
V CPU 231674233 $E5D4 136 099: BEQ F7; [Z___B__] A:00 X:00 Y:0A S:F3
V CPU 231674236 $E5CD 136 105: LDA C6; [Z___B__] A:00 X:00 Y:0A S:F3
V CPU 231674239 $E5CF 136 111: STA CC; [Z___B__] A:00 X:00 Y:0A S:F3
V CPU 231674242 $E5D1 136 117: STA 0292; [Z___B__] A:00 X:00 Y:0A S:F3
V CPU 231674246 $E5D4 136 125: BEQ F7; [Z___B__] A:00 X:00 Y:0A S:F3
V CPU 231674249 $E5CD 137 005: LDA C6; [Z___B__] A:00 X:00 Y:0A S:F3
V CPU 231674252 $E5CF 137 011: STA CC; [Z___B__] A:00 X:00 Y:0A S:F3
V CPU 231674255 $E5D1 137 017: STA 0292; [Z___B__] A:00 X:00 Y:0A S:F3
...contains several informations:
The following out show the high detail of a debug output from a 1541 drive:
V CPU 10749305 $EC98 000 000: STA 1C00; [Z__CB_I] A:F0
X:00 Y:FF S:45
D Memory 10749306 $EC98 000 000: Read $EC99=$00
D Memory 10749307 $EC98 000 000: Read $EC9A=$1C
D Memory 10749308 $EC98 000 000: Write $1C00=$F0
V VIA 10749308 $EC98 000 000: Set Port B to $F0
D Memory 10749309 $EC9B 000 000: Read $EC9B=$4C
D Memory 10749309 $EC9B 000 000: Read $EC9C=$FF
D Memory 10749309 $EC9B 000 000: Read $EC9D=$EB
D Memory 10749309 $EC9B 000 000: Read $EC9C=$FF
D Memory 10749309 $EC9B 000 000: Read $EC9D=$EB
D Memory 10749309 $EC9B 000 000: Read $EC9C=$FF
D Memory 10749309 $EC9B 000 000: Read $EC9D=$EB
V CPU 10749309 $EC9B 000 000: JMP EBFF; [Z__CB_I] A:F0 X:00 Y:FF S:45
D Memory 10749310 $EC9B 000 000: Read $EC9C=$FF
D Memory 10749311 $EC9B 000 000: Read $EC9D=$EB
D Memory 10749312 $EBFF 000 000: Read $EBFF=$58
V CPU 10749312 $EBFF 000 000: CLI; [Z__CB_I] A:F0 X:00 Y:FF S:45
D Memory 10749314 $EC00 000 000: Read $EC00=$A5
D Memory 10749314 $EC00 000 000: Read $EC01=$7C
D Memory 10749314 $EC00 000 000: Read $EC01=$7C
D Memory 10749314 $EC00 000 000: Read $EC01=$7C
V CPU 10749314 $EC00 000 000: LDA 7C; [Z__CB__] A:F0 X:00 Y:FF S:45
D Memory 10749315 $EC00 000 000: Read $EC01=$7C
V Memory 10749316 $EC00 000 000: Read $007C=$00 Flag for ATN from serial bus
receiving; ATN interrupt
D Memory 10749317 $EC02 000 000: Read $EC02=$F0
D Memory 10749317 $EC02 000 000: Read $EC03=$03
D Memory 10749317 $EC02 000 000: Read $EC03=$03
Access to known adresses or chip registers are commented and described, so you don't have to look to often into your chip descriptions.
Other debugging or tracing features are the VIC debugger and the disassembler, their outputs will also be written into the Documents\YACE\logs folder.
With the console you can set breakpoints and log levels at specific times or actions.